NOAA Tides And Currents Station Map
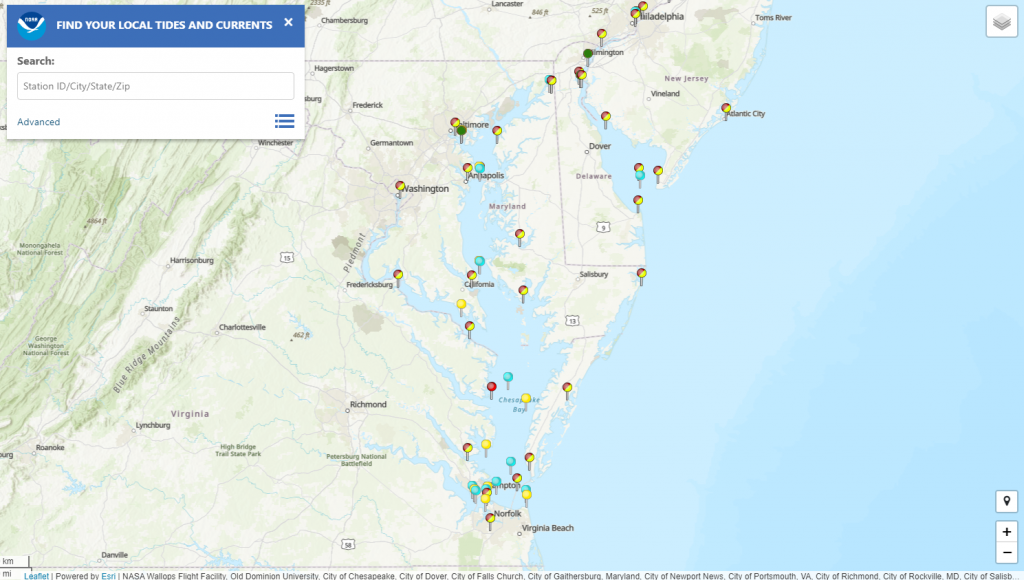
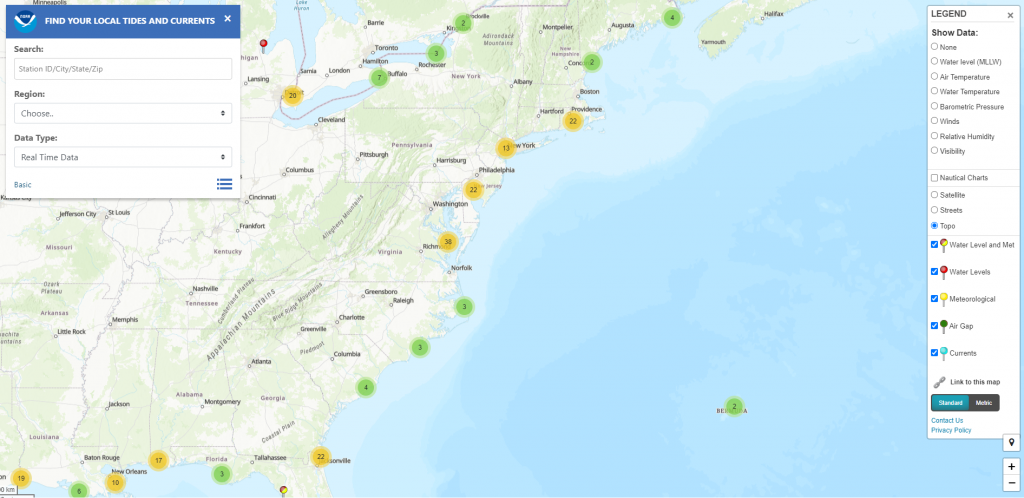
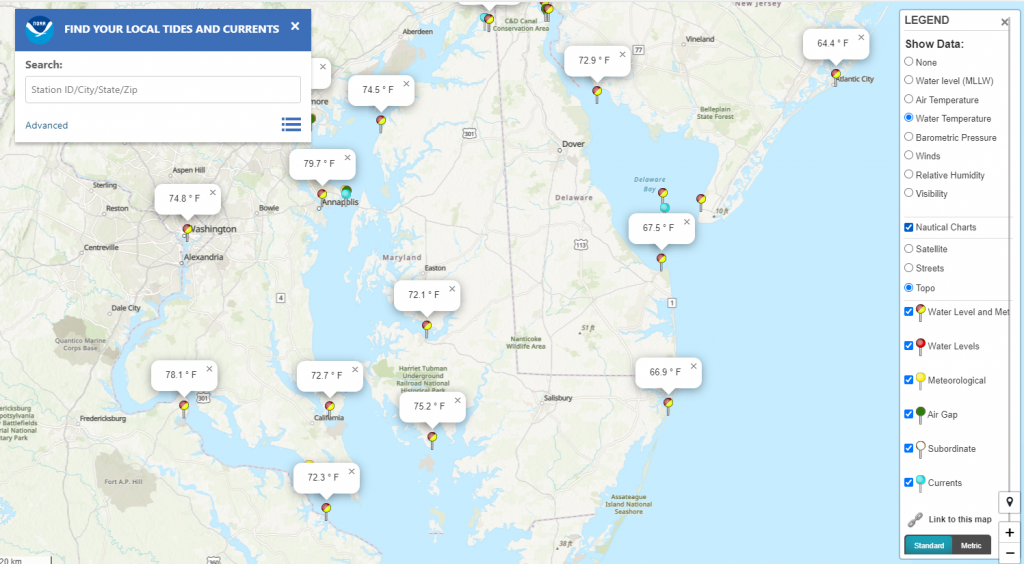
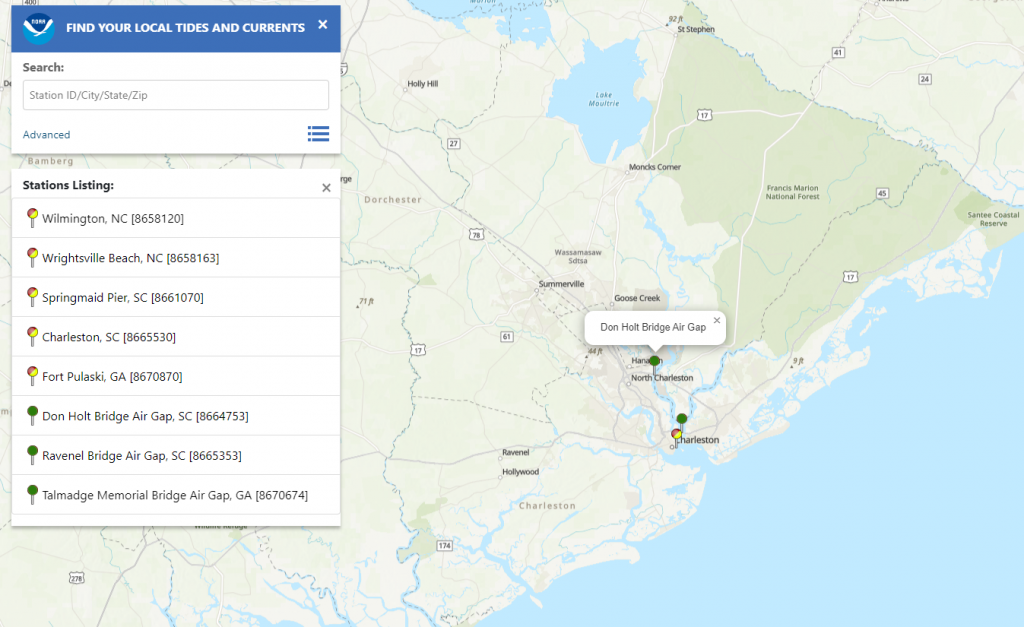
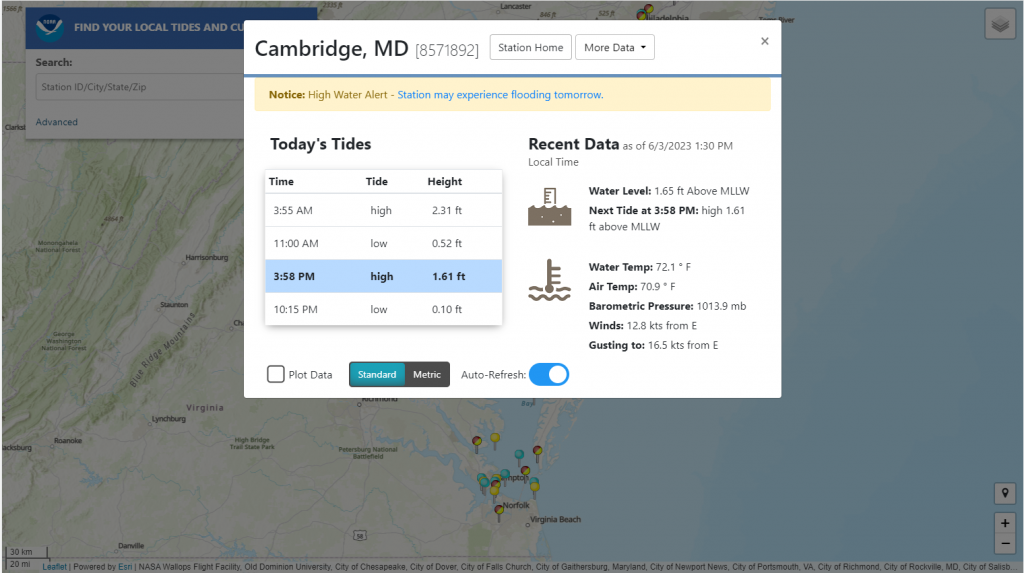
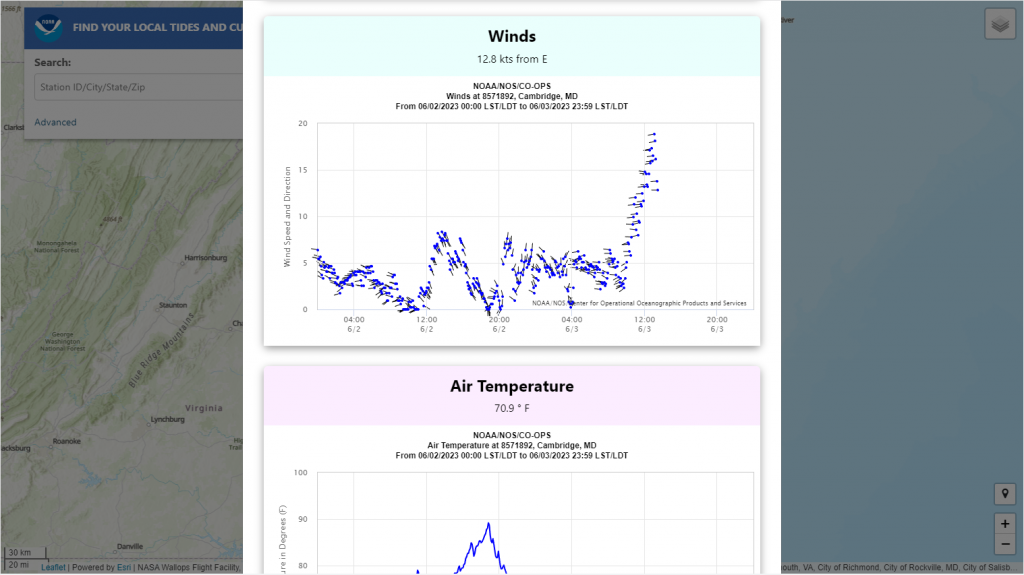
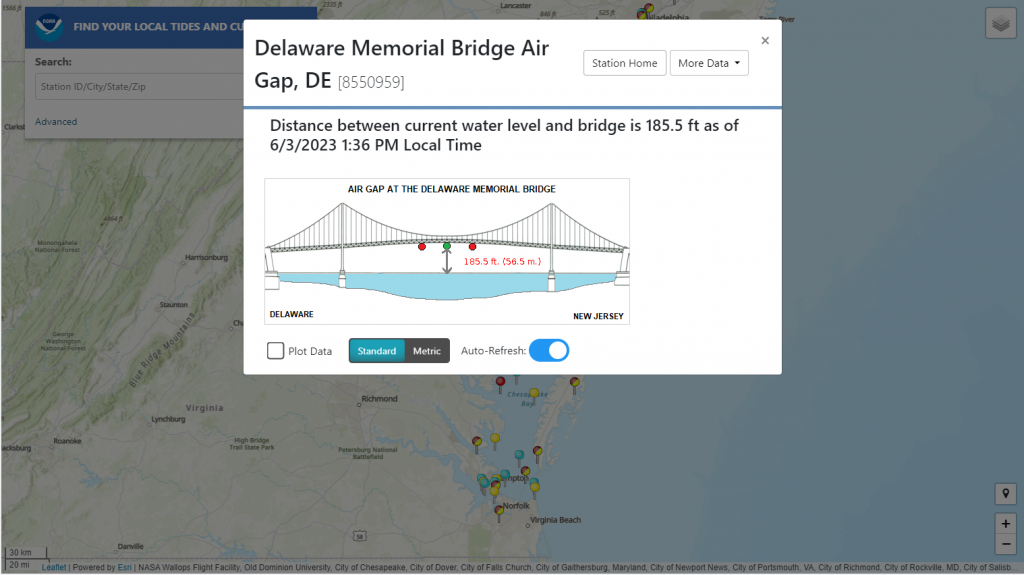
This is the feature product of the National Ocean Service Tides and Currents website. You can view this map here. The map is a visual display of all of the coastal tide stations across the USA and territories, as well as the various tide data collected. The initial proposal was to replace an existing legacy map, writing this now I wish I had kept the screenshots of the old UI for comparison. The data in the old map was coming from perl script calls to the database, and the new map was going to integrate all of the new API capabilities that the NOS Center for Operational Oceanographic Products and Services (CO-OPS) have produced.
I was the main developer and designer of this product working alongside NOS oceanographers to execute their requirements. The map is using LeafletJS and HighchartsJS for the charts. The main challenge with this product is the large amount of data and API calls needed. There was also a learning curve at the time of development learning about all of the types of tide stations and ocean data that needed to be represented.